


Build a LinkedIn Content Tracker on Notion from scratch with me! (Part 2)

A few days ago I put up my first Notion template for sale! I also posted about its features, benefits, and how to use it.
Click here to see the post:

Today I’ll teach you how to build this template from scratch. (If you don’t want to pay $10 for the template.) But, if you want to get it immediately without building it, you can buy it here!
https://stayontask.gumroad.com/l/linkedincontenttracker
Welcome to part 2! If you haven’t read part 1, I split this tutorial in half to get these posts out faster. Here’s the link to part 1:
Build a LinkedIn Content Tracker on Notion from scratch with me! (Part 1)

A few days ago I put up my first Notion template for sale! I also wrote a post about its features, benefits, and how to use it. Click here to see the post: Today I’ll teach you how to build this template from scratch if you’re more of a DIY kind of person. (Also if you don’t want to pay $10 for the template.) But, if you want to get it immediately withou…
In Part 1, I explained that this template has 7 parts.
Posts Database
Notes Database
Analytics Database
Home Page
Analytics Section
Focus Page
Document Templates
Now we should have 3 of those parts done: the Posts Database, Notes Database, and the Home Page. This is what we have left:
Analytics Database
Analytics Section on Home Page
Focus Page
Document Templates
So let’s finish this template off!
Analytics Database
So this template will keep track of all our post statistics and analytics. It will take some numbers from the Post Database and we’ll create formulas to show ratios and percentages.
To create the database, go into an empty block and type “/page”. When you enter the page, click on “Table” near the bottom right. On the right, select “New table” and call it “Analytics”. (For the sake of not having to write “Analytics Database” every time I refer to this page. Also, I will change the Post Database and Notes Database names to just “Posts” and “Notes”.)
Let’s start creating properties.
Delete the “Tags” property.
Add a “Relation” property.
Under “Related to”, select “Posts”.
Make sure to NOT show on “Posts”.
Click on “Add relation”.
Now that we have a Relation, we can add all the rollups. This might take a while because we need to add 10 rollups and 6 formulas.
Add a property as a “rollup”.
For “Relation”, select “Posts”.
Duplicate the property until there are 10 rollup columns. It should say “Duplicate Property” when you click on the property name.
Let’s go through the rollups.
First, we have the link to the post.
In the first rollup column, select “Edit property”.
Next to “Property”, click on the menu and select your “Link to Post” property from “Posts”.
Make sure under “Calculate”, it says “Show original”.
Do this same method for the rest of the rollups.
The next three are the independent variables.
The 2nd - 4th rollups will be “Hashtags”, “Topics”, and “Day and Time”.
Go into each Rollup menu to select each of those 3 in the “Property” menu.
This is what it should look like so far:

The next 6 will be the numbers from “Posts”.
Impressions, Likes, Comments, Reposts, Followers, and Followers Gained.
Go into each rollup menu to select each of those 6 in the “Property” menu.
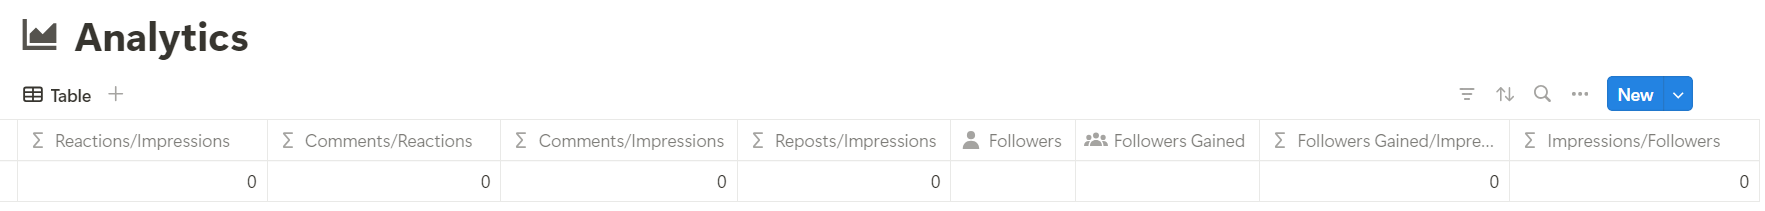
This is how it should look with the 10 rollups.

Let’s add the 6 formulas.
Add a new property and select “Formula”.
Duplicate until you have 6 of these columns.
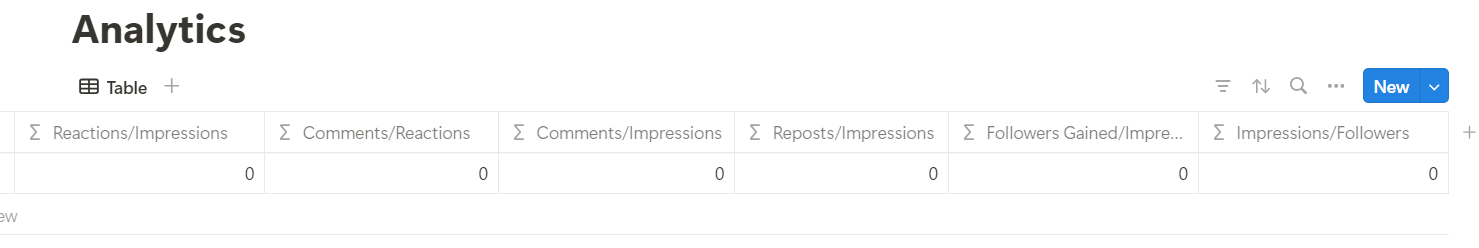
Name the first column “Reactions/Impressions”.
Click on the formula box below the top row.
There should be your properties listed right below the text box.
Select “Reactions”, type “/” and then select “Impressions”.
You’ll notice this message pop up: “Cannot do math on array and array. [0,3]”. This is because rollups are arrays1 by default so you can’t do math operations on them. To fix this, we will take just the first (and only) value of the arrays in each rollup.
So type in “first()” twice (for each of the property names) and insert the rollups into the brackets. The entire formula should look like this. We’ll be using this structure for the rest of the formulas.

Name the second formula “Comments/Reactions”.
In the formula box, type in “first(Comments)/first(Reactions)”.
For the property names, you can just select from the list below the text box.
Name the third formula “Comments/Impressions”. I think you can see where I’m going with this.
In the formula box, type in “first(Comments)/first(Impressions)”.
Again, select the properties from the list.
The fourth should be called “Reposts/Impressions”.
In the formula box, type in “first(Reposts)/first(Impressions)”.
The fifth should be called “Followers Gained/Impressions”.
In the formula box, type in “first(Followers Gained)/first(Impressions)”.
The final formula should be called “Impressions/Followers”.
In the formula box, type in “first(Impressions)/first(Followers)”.
This is how it should look with all of the formulas. I’ll add example posts and fill in all of the numbers so that you can see how it works.
That’s the full database complete! Now let’s add a section to the Home Page of organized versions of this table.
Analytics on the Home Page
Let’s go back to the Home Page.
Scroll down below the calendar and enter a new line.
Let’s add a divider. Just type “-” 3 times and you’ll see a thin gray line across the page.
To give this section a heading type “/h1” and hit Enter. Type “Analytics” as the header.
We will have 3 parts of this section each containing a table with three tabs.
The Basic Stats - Impressions, Reactions, Comments, Reposts.
The Engagement Stats (the ratios) - Reactions/Impressions, Comments/Reactions, Comments/Impressions, Reposts/Impressions.
The Follower Stats - Followers, Followers Gained, Followers Gained/Impressions, Impressions/Followers.
Don’t worry, this will take shorter than you think. It’s all about copy + paste!
Enter a new line and type “/linked” for a new database.
Select your “Analytics” page.
Select “Table” since you don’t need a new view.
Make sure the properties are all ordered the way we made them in the previous section. This is how the order should be:

We’ll have 3 tabs in each section, for the 3 independent variables of this data.
Day and Time
Hashtags
Topics
At the top left of the table, click on “Table” and select “Duplicate” in the menu. Do this twice so you have 3 tabs.
Name the first one “Day and Time”.
In this view, remove (not delete!) the “Hashtags” and “Topics” from the shown properties.
Name the second “Hashtags”.
In this view, remove (again, not delete!) the “Day and Time” and “Topics” from the shown properties.
Name the third “Topics”.
In this view, remove (again, not delete!) the “Day and Time” and “Hashtags” from the shown properties.
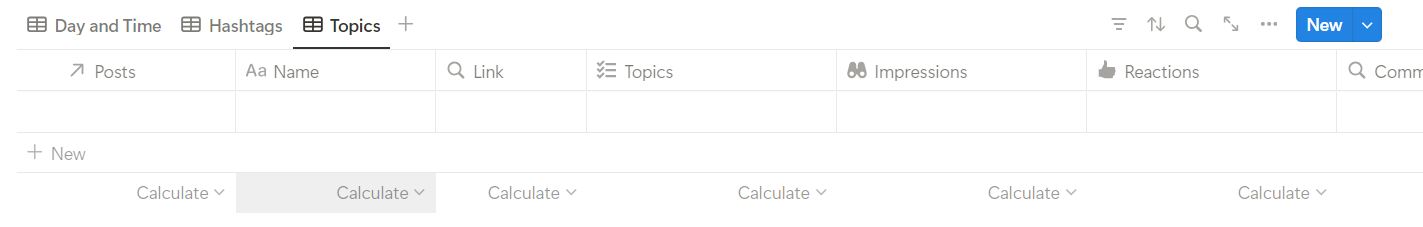
This is what each view should look like right now.


We need to make 3 of these, so we have to duplicate it twice. To duplicate the table, hold “alt” and drag the table down with the 6 dots on the left. Now there should be two identical tables. Do this again and you’ll get a third.
Let’s make the headings for each table. Type in “/h2” for Heading 2 text.
Above the first table, name it “Basic Stats” in the heading.
This table will just show Impressions, Reactions, Comments, and Reposts in each of the three tabs.
To change the shown properties, click on the 3 dots at the top right of the table next to the blue “New” button.
In the menu, select “Properties”.
Use the eye icon next to all of the property names to hide the property. For this section, hide everything below “Reposts” as shown in the video.


Above the second table, write “Engagement” in the heading.
This table will show Reactions/Impressions, Comments/Reactions, Comments/Impressions, and Reposts/Impressions.
To change the shown properties, click on the 3 dots at the top right of the table and select “Properties”.
Use the eye icon to hide the properties. For this section, hide the properties from Impressions to Reposts and from Followers and below. See the video.
Above the third table, write “Followers” in the heading.
This table will show Followers, Followers Gained, Followers Gained/Impressions, and Impressions/Followers.
To change the shown properties, click on the 3 dots at the top right of the table and select “Properties”.
Use the eye icon to hide the properties. For this section, hide all properties from Impressions to Reposts/Impressions. See the video.
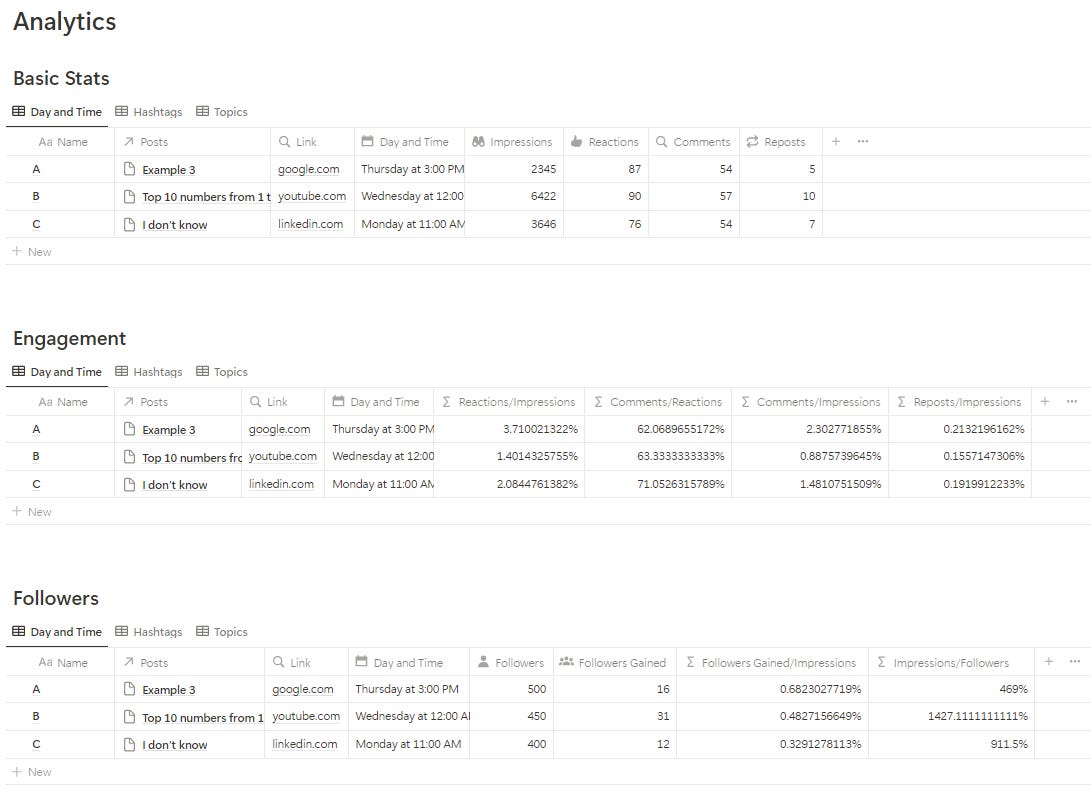
With that, we’re finished with the Analytics section. Here’s what the completed section should look like, including some posts that you can compare:
We set the formulas up to show as regular numbers but if you want percentages:
For each formula, go to “Edit property”, click on “Number format”, and select “Percent”.
We only have a few sections left in this template before you have a fully functioning LinkedIn Content Tracker!
The Focus Page
In my template walkthrough post, I said that the Focus Page is meant to block out all the other distractions with a minimal design to help you focus on writing or editing. Now when I said distractions, I meant the rest of my template. But my template isn’t a distraction!
The better wording would be: Without the pressure of a calendar or analytics, this page helps you enter a flow state where you can write or edit without interruption. That’s why I called it a Focus Page. I believe more templates should have a feature like this. One that cuts through the noise and helps you get started.
Anyways, let’s build it!
Enter a new line at the top and type in “/page” to create a new page. Name this one “Focus”. There are 4 parts to this: the buttons, the writing section, the editing section, and the notes section. This should be much faster than the other sections since we have everything we need.
Buttons
We’ll have three buttons: “New Post”, “New Note”, and “Open Notes”. What’s great is that we’ve already created these buttons on the Home Page (except “Open Notes” oops). All we have to do is duplicate them.
Go back to the Home Page.
Hover your mouse over the “New Draft” button.
Hold “alt” and drag the button with the 6 dots on the side.
Drag the button into the Focus page. The page should highlight blue when the button is hovering over it.
Hover your mouse over the “New Notes” button and do the same “alt” and drag into the Focus page again.
Go back to the Focus page. Both buttons should be there.
Enter a new line and type “/button” to create a new button.
Name it “Open Notes”.
Click on “Add action” and select “Open page”.
Click on “Select page” and select “Notes”.
Set it to open in “Full page”, otherwise the database won’t show.
You can also put the buttons in columns to save space.
Writing
Enter a new line below the buttons and type “/h1”. Name this section “Write”.
Let’s make a table that helps you focus on what you need to write.
Type “/linked” and hit Enter.
Select your Posts database.
Select “New table view”.
You can name it “Write” or “To Write”.
Click on the filter icon on the top bar of the table.
Select “Status” and filter only for “Ideas”.
The only properties that need to be shown here are “Name”, “Type”, “Status”, and “Related Notes”.
That’s it. You can also hide the database title by clicking on the 3 dots next to it and selecting “Hide database title”.
Editing
Enter a new line below the Writing section and type “/h1”. Name this section “Edit”.
Let’s make the Editing table which just focuses on posts that you need to edit.
Type “/linked” and hit Enter.
Select your Posts database.
Select “New table view”.
Name it “Edit” or “Editing”.
Click on the filter icon on the top bar of the table.
Select “Status” and filter only for “Drafts”.
You can show more properties in this view like “Days from Post”, “Carousel File”, “Hashtags” and “Topics”.
Notes Gallery
Let’s create the notes gallery. We can do the same duplication trick with the buttons since we have a version of it on the Home page.
Go back to the Home Page.
Hover over the 6 dots in the Notes gallery to drag.
Hold “alt” and drag the gallery into the Focus page like before.
Go back to the Focus page.
Right above the Notes gallery, type “/h1” for a heading and type “Notes” as the name of the section.
You don’t need to change any of the gallery settings.
Focus Page done! We have one more section left! We’re almost there!
Document Templates
When you start writing a post, you don’t always want to start with an empty page with no outline or prompts. You also don’t want to keep writing the same lines repeatedly.
For example, in all of my posts, I have this line: “Follow me at Sidd Shenoi and repost to your network!”
Since I don’t want to write that every time. I create templates. Not to be confused with Notion templates that are full systems. These are document templates that will create pages with text automatically filled in. Let’s create some in our Posts database!
We’re going to be creating 2: one for written posts, and one for carousels.
Go to the Posts full-page database. On the top right of the table, there should be a blue button saying “New”. Click on the down arrow next to that and click on where it says “New template”. Do this for both templates.
Written Post Templates
Name it “Post”. Or you don’t have to name it.
Set the Type to “Post”.
Set the Status to “Idea” or “Draft” whichever you prefer.
Finally, write some common phrases that you always say in every post.
Just click outside of the template to stop editing.
Carousel Post Templates
Name this template “Carousel”. Or leave it blank.
Set the Type to “Carousel”.
Set the Status to “Idea” or “Draft” whichever you prefer.
In this template, you can put links to Canva, Google Slides, or wherever you create LinkedIn carousels.
You can also type “/image” to create a box to put your carousel file in.
Click outside of the template to stop editing.
If you want to go back and edit the template again:
Go back to the down arrow in the blue box.
Click on the 3 dots across from the template name.
Click on “Edit”.
Add it to the buttons!
Go to the Home page.
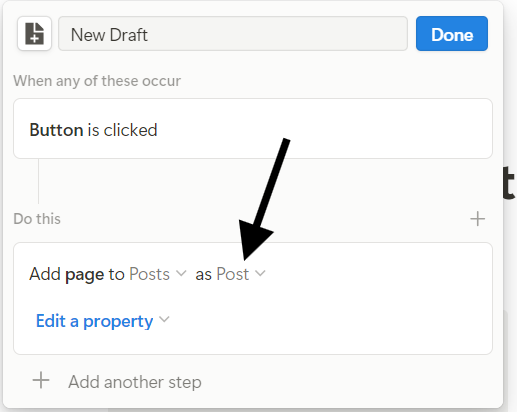
Click on the gear next to the “New Draft” button to edit.
Where it says “Add page to “Posts” as Empty”, click on “Empty” to switch it to the “Post” template.
Do the same for the “New Carousel” button and switch it to the “Carousel” template.
Now any time you click on the buttons, it should each create a new page with the templates.
You can do the same thing for the buttons on the Focus page.
And that is the LinkedIn Content Tracker!
Conclusion
Congratulations! That took a while but now you have your own LinkedIn Content Dashboard to help you rise to the next level in your LinkedIn writing journey. Also, you didn’t have a spend a dollar! You have this for free now!
Here’s the link if you still want to buy it: https://stayontask.gumroad.com/l/linkedincontenttracker
Check out my other articles! If you like my content, consider subscribing!
Thanks for reading.
Arrays in programming are essentially a list of values, whether numbers or text. They usually cannot be changed once the values are set.